

Data Solutions Simplified
Unlock the power of your data with our innovative and tailored data solutions for your business.
Data Solutions
Innovative data solutions for your business growth and efficiency.


Data Strategy & Consulting
In today's market, data is your most valuable asset, but only if you have a plan. Our Data Strategy & Consulting service transforms your data from a complex challenge into a strategic advantage. We work with you to assess your current capabilities, understand your business goals, and create a clear, actionable roadmap. With DataSparkInnovations, you'll get a holistic strategy that ensures every data investment you make is targeted, efficient, and directly aligned with driving your growth.


Data Engineering & Pipeline Development
Reliable insights begin with reliable data. Our Data Engineering service builds the robust and scalable infrastructure your business needs to thrive. We design and develop powerful data pipelines that automatically collect, clean, and integrate data from all your disparate sources into a single, unified system. The result is a dependable, high-performance data foundation, ensuring your teams have constant access to the fresh, accurate information needed for analysis and AI.


Advanced Data Analytics & Insights
Business Intelligence (BI) & Data Visualization
Standard reports can tell you what happened, but our Advanced Data Analytics services tell you why it happened. We go deeper than dashboards, using sophisticated statistical analysis and data mining techniques to uncover the hidden patterns, root causes, and complex relationships within your data. Whether it's understanding customer behavior or optimizing operations, we provide the deep, actionable insights that lead to smarter strategies and breakthrough performance.
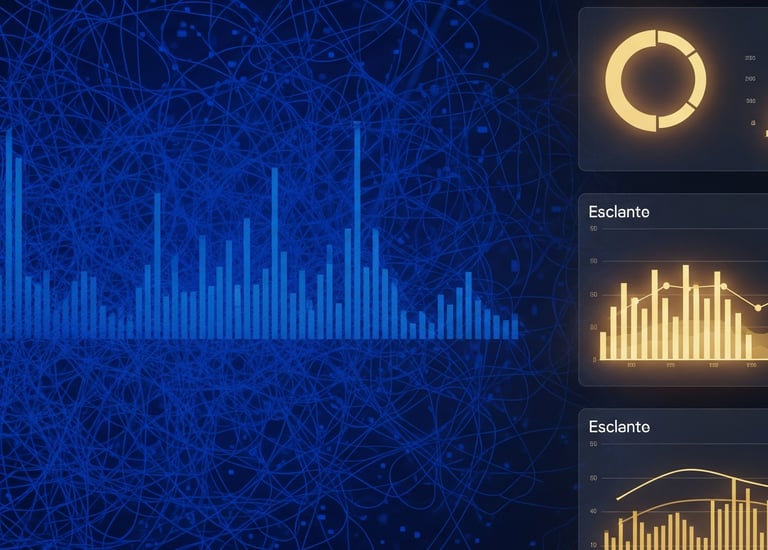
Transform your raw numbers into clear, compelling stories. Our Business Intelligence & Data Visualization service turns complex data into intuitive, interactive dashboards and reports. We empower your teams by putting real-time KPIs and critical metrics at their fingertips, eliminating the need for cumbersome spreadsheets. With visually engaging and easy-to-understand dashboards, we help foster a data-driven culture where everyone can make faster, more informed decisions.


Data Governance & Quality Management
The value of your analytics and AI is only as good as the quality of your data. Our Data Governance & Quality Management service is designed to build trust and integrity across your entire data ecosystem. We establish clear frameworks for data security, compliance, and access while implementing rigorous processes to cleanse, validate, and maintain data accuracy. With DataSparkInnovations, you can mitigate risk and make critical business decisions with complete confidence.
We forge the trustworthy backbone of your data and lay the strategic roadmap for your success. This empowers you to move beyond just seeing your data, allowing you to make confident decisions by uncovering the critical 'why' that drives real growth.
Accurate, fast, and highly detailed — their data solutions helped us identify trends we never saw before
John Doe

Their data analysis gave us actionable insights that completely transformed our decision-making process
Rehan Wali

★★★★★
★★★★★
Vava Clothing LTD
VRemit UK
Our Mission
To translate complex data into clear, profitable action through a powerful synergy of AI-driven intelligence and hands-on ecommerce management.
Contact us
Submit
© 2025. All rights reserved.
FOR ECOMMERCE SERVICE
FOR AI/DS SERVICES